

Growing a B2B SaaS company requires more than acquiring new customers and increasing monthly revenue. Businesses must understand customer acquisition costs, recurring revenue, customer retention, lifetime value, churn rates, and overall profitability. Without accurate data, it becomes difficult to identify growth opportunities, manage marketing budgets, and make informed business decisions. This is where SaaS metrics tools become essential.
SaaS metrics tools help businesses measure performance, track important financial indicators, analyze customer behavior, and understand whether their growth strategies are delivering results. For companies operating in the business-to-business software industry, these tools provide valuable insights into long sales cycles, recurring subscriptions, customer relationships, and revenue forecasting.
Choosing the right SaaS analytics tools can help a growing B2B company improve operational efficiency, strengthen customer retention, and build a more predictable revenue model. However, not every business needs an extensive collection of expensive software. The ideal approach is to select tools that match the company’s current size, business model, reporting requirements, and growth objectives.
In this guide, we will explore the most useful SaaS metrics tools for growing B2B companies, the essential metrics they should track, and how businesses can choose the right solutions for sustainable growth.
What Are SaaS Metrics Tools?
SaaS metrics tools are software applications, analytics platforms, and calculators designed to measure the performance of a Software-as-a-Service business. They collect, organize, and analyze data related to revenue, subscriptions, customer acquisition, retention, product usage, and business profitability.
These tools help business owners, marketing teams, sales professionals, and financial managers understand how effectively their company attracts customers, generates recurring revenue, and maintains long-term relationships.
For example, a B2B software company might use a Monthly Recurring Revenue (MRR) calculator to measure predictable monthly subscription income. It could also use a Customer Acquisition Cost (CAC) calculator to determine how much it spends to acquire each customer.
When these metrics are analyzed together, businesses can identify inefficient marketing campaigns, improve pricing strategies, and make more informed decisions about future investments.
Common categories of SaaS metrics tools include:
- Revenue and subscription analytics tools
- Customer acquisition cost calculators
- Customer lifetime value calculators
- Churn rate and retention analysis tools
- Product analytics platforms
- Customer relationship management (CRM) systems
- Financial forecasting and business intelligence tools
Each category serves a different purpose. Combining the right tools gives growing B2B companies a clearer understanding of their overall performance.
Why Growing B2B Companies Need SaaS Metrics Tools
As a B2B SaaS business expands, its operations become more complicated. The company may have multiple pricing plans, different customer segments, longer sales cycles, and larger marketing budgets. Managing all this information manually can lead to inaccurate reporting and missed opportunities.
SaaS performance tracking tools help companies overcome these challenges by providing consistent, measurable insights.
1. Improve Revenue Visibility
Recurring revenue is one of the most important indicators of SaaS business performance. Revenue analytics tools help companies monitor subscription income, upgrades, downgrades, cancellations, and expansion revenue.
By tracking MRR and Annual Recurring Revenue (ARR), businesses can evaluate revenue growth and develop more realistic financial forecasts.
2. Optimize Customer Acquisition Costs
B2B companies often invest in search engine optimization, paid advertising, content marketing, email campaigns, and sales teams. Without accurate tracking, it can be difficult to determine which channels produce valuable customers.
Customer acquisition cost tools help companies calculate the average cost of acquiring a new customer. This information supports better marketing budget allocation and helps teams focus on efficient acquisition channels.
3. Increase Customer Retention
Acquiring customers is only part of the growth process. Businesses must also retain existing customers and encourage long-term subscriptions.
Churn analysis tools reveal how frequently customers cancel subscriptions or reduce their spending. These insights can help customer success teams identify problems, improve onboarding, and strengthen customer relationships.
4. Make Data-Driven Decisions
Instead of relying on assumptions, companies can use measurable performance indicators to guide decisions. SaaS analytics dashboards consolidate important information into reports that make trends and performance changes easier to understand.
5. Support Scalable Growth
A scalable business model requires predictable revenue, manageable acquisition costs, and sustainable customer retention. Tracking these factors helps management identify weaknesses before they become larger operational problems.
Essential SaaS Metrics Every B2B Company Should Track
Before choosing specific software, businesses should identify which metrics matter most to their business model.
Monthly Recurring Revenue (MRR)
MRR represents the predictable monthly subscription revenue generated by active recurring customer contracts.
A basic calculation is:
MRR = Sum of Monthly Recurring Subscription Revenue
For annual subscriptions, divide the recurring annual contract value by 12 to estimate its monthly equivalent. One-time fees and nonrecurring services should generally be excluded from standard MRR calculations.
MRR tracking tools help companies monitor new subscriptions, upgrades, downgrades, and cancellations. They are especially useful for evaluating subscription growth and forecasting future revenue.
Annual Recurring Revenue (ARR)
ARR estimates the annualized value of recurring subscription revenue.
ARR = MRR × 12
This simplified calculation works when MRR represents a consistent recurring revenue base. Businesses with seasonal contracts, variable usage charges, or complex enterprise agreements may need a more detailed calculation.
ARR is particularly useful for B2B SaaS companies that sell annual contracts or enterprise software subscriptions.
Customer Acquisition Cost (CAC)
CAC measures the average cost of acquiring a new customer.
CAC = Total Customer Acquisition Costs ÷ Number of New Customers Acquired
Businesses should define which expenses to include, such as advertising, sales salaries, marketing software, agency fees, and relevant overhead. They should also align the costs and customer acquisition period appropriately.
A CAC calculator helps companies understand how much they spend to generate new business and whether their acquisition strategy is financially sustainable.
Customer Lifetime Value (LTV)
Customer Lifetime Value estimates the revenue or gross profit a business expects to generate from a customer throughout the relationship.
A simplified revenue-based estimate is:
LTV = Average Revenue Per Account × Average Customer Lifetime
For stronger financial analysis, businesses should consider gross margin, retention patterns, expansion revenue, and discounting where appropriate. LTV estimates can be unreliable when based on limited historical data or unstable churn rates.
Comparing LTV with CAC helps management evaluate customer acquisition efficiency.
Customer Churn Rate
Customer churn rate measures the percentage of customers who stop using a service during a specific period.Customer Churn Rate = Customers Lost During the Period ÷ Customers at the Start of the Period × 100
Businesses should define how they treat reactivations, account mergers, and customers who downgrade rather than cancel.
Monitoring churn helps B2B companies understand whether their products deliver sufficient value to maintain long-term customer relationships.
Customer Retention Rate
Customer retention rate measures the proportion of existing customers who remain customers throughout a given period.Customer Retention Rate = (Customers at the End − New Customers Acquired) ÷ Customers at the Start × 100
This formula assumes consistent customer definitions and a clearly defined reporting period. Retention analysis is particularly valuable for subscription-based businesses with recurring contracts.
Average Revenue Per Account (ARPA)
ARPA measures the average recurring revenue generated per customer account over a specified period.ARPA = Recurring Revenue During the Period ÷ Average Number of Paying Accounts
ARPA helps B2B companies compare customer segments, evaluate pricing plans, and identify opportunities for expansion revenue.
Best SaaS Metrics Tools for a Growing B2B Company
The best SaaS metrics tools depend on a company’s size, budget, sales process, and reporting needs. Some businesses need dedicated subscription analytics, while others benefit more from CRM reporting, product analytics, or customizable calculators.
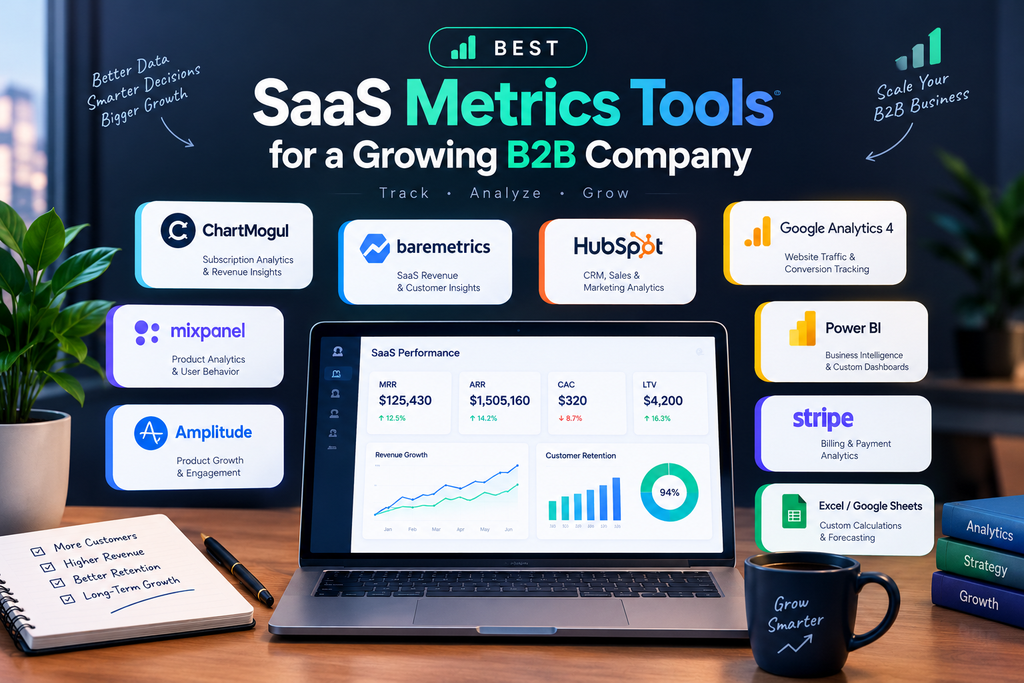
The following platforms represent useful options to evaluate.
1. ChartMogul for Subscription Analytics
ChartMogul is a subscription analytics platform designed to help recurring-revenue businesses understand their financial performance.
It provides reporting for key subscription metrics, including MRR, ARR, customer churn, retention, and customer lifetime value.
Key benefits:
- Monitor recurring revenue trends.
- Analyze customer retention and churn.
- Segment revenue by customer characteristics.
- Compare subscription performance over time.
- Build a clearer picture of SaaS growth.
ChartMogul can be useful for B2B SaaS businesses that need dedicated subscription reporting beyond basic accounting software.
It is particularly relevant when a company has multiple subscription plans, different customer segments, or a growing base of recurring contracts.
2. Baremetrics for SaaS Revenue Insights
Baremetrics focuses on subscription analytics and financial insights for SaaS businesses.
It helps companies understand revenue performance, subscription changes, customer behavior, and recurring-revenue trends.
Key benefits:
- Track subscription revenue.
- Review churn and retention patterns.
- Analyze customer lifetime value.
- Monitor revenue changes.
- Support recurring-revenue reporting.
Baremetrics may suit subscription companies that want a dedicated view of their revenue and customer metrics.
Before selecting a subscription analytics platform, businesses should confirm that it supports their payment processor, billing system, and reporting requirements.
3. HubSpot for Sales and Marketing Metrics
HubSpot provides CRM, marketing, sales, and customer service capabilities. Its reporting tools can help B2B companies connect lead generation, sales pipeline activity, and customer acquisition performance.
Key benefits:
- Track leads and sales opportunities.
- Measure conversion rates across the funnel.
- Monitor sales pipeline value.
- Analyze marketing campaign performance.
- Organize customer and prospect information.
HubSpot is particularly useful for companies with longer B2B sales cycles involving multiple decision-makers.
Although CRM reports can support acquisition analysis, businesses may need additional billing or finance data to calculate complete CAC, LTV, and recurring revenue accurately.
4. Google Analytics 4 for Website Performance
Google Analytics 4 helps businesses measure website traffic, user engagement, and conversion events.
For B2B companies that rely on organic search, paid campaigns, and content marketing, website analytics can reveal how visitors interact with their online properties.
Key benefits:
- Measure website traffic and engagement.
- Track important conversion events.
- Analyze traffic sources and landing pages.
- Evaluate content performance.
- Understand user journeys across supported touchpoints.
For companies investing in SEO, Google Analytics 4 can help evaluate whether organic traffic contributes to meaningful actions such as demo requests, contact form submissions, and trial registrations.
However, website analytics alone does not provide a complete picture of subscription revenue or customer profitability. Connecting analytics with CRM and billing data provides more useful business insights.
5. Mixpanel for Product Analytics
Mixpanel is a product analytics platform that helps businesses understand how users interact with their applications.
B2B SaaS companies can use product analytics to monitor activation, feature adoption, user engagement, and product usage patterns.
Key benefits:
- Track important product events.
- Analyze user activation and onboarding.
- Identify frequently used features.
- Compare behavior across customer segments.
- Investigate product engagement and retention.
For example, a B2B software company might discover that customers who complete a particular onboarding step are more likely to remain active.
Product analytics can help the company improve the onboarding experience and prioritize features that support customer value.
6. Amplitude for Product Growth Analytics
Amplitude provides product analytics and related digital experience measurement capabilities.
It helps teams explore user journeys, analyze behavioral patterns, and understand how product experiences relate to engagement and retention.
Key benefits:
- Analyze user journeys.
- Measure feature adoption.
- Evaluate activation and engagement.
- Segment product users.
- Investigate behavior associated with retention.
Amplitude can be valuable for growing B2B companies with complex products or multiple user roles.
Its usefulness depends on the quality of event tracking and the company’s ability to connect product behavior with account-level outcomes.
7. Power BI for Business Intelligence
Microsoft Power BI is a business intelligence platform that helps companies connect data sources, create reports, and build interactive dashboards.
B2B SaaS companies can use it to combine CRM, financial, marketing, and operational data into a consolidated reporting environment.
Key benefits:
- Build customized SaaS KPI dashboards.
- Combine information from multiple sources.
- Compare performance across departments.
- Analyze historical trends.
- Support forecasting and management reporting.
Power BI is especially helpful when a company needs more flexibility than standard reports provide.
However, creating reliable dashboards requires consistent definitions, appropriate data access, and well-maintained integrations.
8. Stripe Billing Analytics for Subscription Businesses
Businesses using Stripe for payments and subscription management can evaluate its billing and revenue reporting capabilities.
Stripe’s available reports and features depend on the products configured, account setup, and reporting needs.
Key benefits:
- Review subscription and payment activity.
- Monitor recurring billing information.
- Investigate failed payments.
- Analyze subscription changes.
- Support revenue operations.
Stripe reporting may be sufficient for some smaller subscription businesses. Companies requiring more advanced cohort analysis, multi-source reporting, or specialized SaaS metrics may benefit from a dedicated analytics platform.
9. Excel and Google Sheets for SaaS Metrics Calculators
Spreadsheet tools remain practical options for early-stage B2B companies that need affordable and flexible reporting.
Businesses can build custom calculators for MRR, ARR, CAC, LTV, churn, retention, and ARPA.
Key benefits:
- Low initial cost.
- Flexible metric calculations.
- Customizable reports and dashboards.
- Easy scenario planning.
- Simple collaboration and data review.
For example, a company can create a monthly report that compares marketing spending, new customers, subscription revenue, and customer churn.
However, spreadsheets require regular maintenance and careful validation. As data volume increases, manual reporting can become time-consuming and vulnerable to errors.
SaaS Metrics Tools Comparison
The following table summarizes the primary use cases for these tools.
| Tool | Main Purpose | Best For |
|---|---|---|
| ChartMogul | Subscription analytics | Recurring-revenue reporting |
| Baremetrics | SaaS revenue insights | Subscription performance analysis |
| HubSpot | CRM and marketing analytics | Lead generation and sales tracking |
| Google Analytics 4 | Website analytics | Traffic and conversion measurement |
| Mixpanel | Product analytics | User behavior and activation |
| Amplitude | Product growth analytics | Product engagement and retention |
| Power BI | Business intelligence | Custom dashboards and combined reporting |
| Stripe | Billing and payment analytics | Subscription operations |
| Excel or Google Sheets | Custom calculations | Early-stage reporting and forecasting |
Tool capabilities, integrations, and pricing can change, so businesses should verify current plans and compatibility before purchasing.
How to Choose the Right SaaS Metrics Tools
Selecting software should begin with business requirements rather than a long list of features.
1. Identify Your Primary Business Goals
Determine what your company needs to improve.
If revenue visibility is the priority, subscription analytics may be the best starting point.If the main challenge is generating qualified leads, CRM and marketing analytics may provide greater value.If customers sign up but do not use the product consistently, product analytics should receive more attention.
2. Evaluate Integration Capabilities
Your metrics tools should work with the systems that already manage your business.
Important integrations may include:
- Payment processors and billing systems.
- CRM platforms.
- Website analytics.
- Product event tracking.
- Accounting software.
- Data warehouses and reporting platforms.
Reliable integration reduces manual work and helps maintain consistent reporting.
3. Consider Ease of Use
A powerful platform provides limited value if the team cannot interpret its reports.
Look for clear dashboards, accessible documentation, understandable metric definitions, and reporting features that match your team’s technical skills.
4. Review Pricing and Scalability
Compare software costs with the value it provides.
Consider subscription fees, user limits, data volume, integration costs, implementation time, and additional reporting requirements.
An affordable spreadsheet may be sufficient for a small business, while a company with thousands of accounts may require automated data pipelines and dedicated analytics software.
5. Check Data Quality and Security
Reliable metrics depend on reliable data.
Before choosing a platform, examine how it handles access controls, data retention, privacy, exports, and integrations. Ensure that its security features align with your company’s requirements and applicable obligations.
6. Define Consistent Metric Formulas
Different systems may calculate metrics differently. For example, one platform may measure churn by customer count, while another emphasizes lost recurring revenue.
Document your company’s formulas and reporting periods so that teams can compare results consistently.
How to Build a SaaS Metrics Dashboard
A SaaS metrics dashboard should make important business information easy to understand.
Instead of displaying every available metric, focus on a small group of indicators that reflect the company’s current objectives.
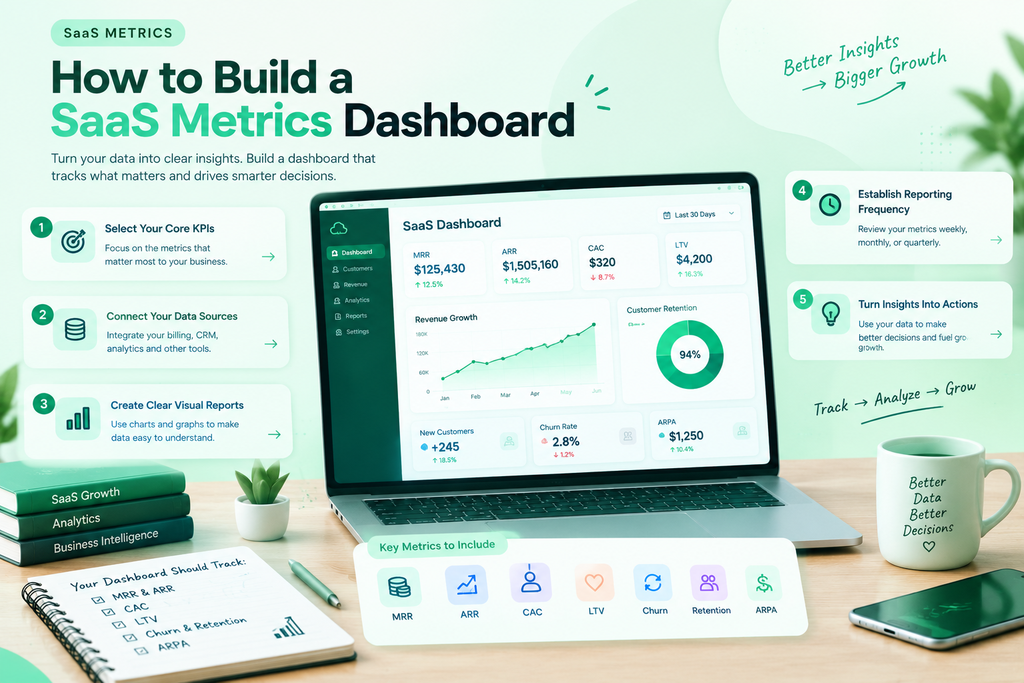
Step 1: Select Your Core KPIs
Start with a practical set of metrics:
- MRR and ARR for recurring revenue.
- CAC for acquisition efficiency.
- LTV for customer value.
- Customer churn and retention for relationship health.
- ARPA for account-level revenue.
- Conversion rates for marketing and sales performance.
Step 2: Connect Your Data Sources
Connect the relevant billing, CRM, website analytics, and product analytics systems.
Make sure the data uses consistent customer identifiers and reporting periods wherever possible.
Step 3: Create Clear Visual Reports
Use charts and tables to highlight revenue trends, customer acquisition performance, churn, and retention.
A monthly revenue chart, an acquisition funnel, and a customer retention report can provide more actionable insight than a dashboard containing dozens of unrelated numbers.
Step 4: Establish Reporting Frequency
Review important operational metrics weekly or monthly, depending on business needs.
Revenue forecasts and strategic performance reviews may require monthly or quarterly analysis, while website conversions and product activation may need more frequent monitoring.
Step 5: Turn Insights Into Actions
Metrics become valuable when they inform decisions.
If CAC increases, investigate campaign performance and sales efficiency.If churn rises, examine customer feedback, product usage, onboarding, and support issues.If expansion revenue grows, identify which customer segments and product features contribute to that improvement.
Common Mistakes to Avoid When Using SaaS Metrics Tools
Even the best SaaS analytics software cannot compensate for poor measurement practices.
Tracking Too Many Metrics
Monitoring every available indicator can distract teams from the factors that matter most.
Choose a manageable set of core KPIs and add secondary metrics when they answer specific business questions.
Ignoring Gross Margin
Revenue growth does not automatically mean profitability. Customer lifetime value is more informative when calculated using gross profit rather than revenue alone.
Confusing Website Visitors With Customers
High traffic can support business growth, but visits do not guarantee qualified leads, paying customers, or recurring revenue.
Connect marketing activity to CRM and billing outcomes whenever possible.
Using Inconsistent Reporting Periods
Comparing acquisition costs from one period with customers acquired in an unrelated period can produce misleading conclusions.
Align reporting windows and document the methodology behind each metric.
Relying on Unverified Data
Duplicate accounts, missing transactions, incorrect event tracking, and inconsistent customer identifiers can distort reports.
Regularly validate the information feeding your dashboards.
Treating LTV-to-CAC Ratios as Universal Benchmarks
The LTV-to-CAC ratio is useful, but an apparently strong ratio does not guarantee a healthy business. Payback period, gross margin, retention quality, cash flow, and growth efficiency also matter.
A Practical SaaS Metrics Tool Stack for Growing B2B Companies
The ideal tool stack depends on the company’s stage of growth.
Early-Stage B2B SaaS Company
A small company can begin with Google Analytics 4 for website measurement, a CRM for lead tracking, and spreadsheets for calculating core SaaS metrics.
This approach helps establish consistent measurement without requiring a complex technology stack.
Growing B2B SaaS Company
As customer volume and reporting requirements increase, the company may add dedicated subscription analytics, product analytics, and more automated CRM reporting.
The objective is to reduce manual work and connect customer acquisition with recurring revenue and retention.
Established B2B SaaS Company
A more mature organization may benefit from a centralized business intelligence platform, a data warehouse, automated reporting pipelines, and documented metric definitions.
This setup can provide consistent insights across finance, marketing, sales, product, and customer success teams.
Businesses should expand their tool stack when existing systems create measurable limitations, rather than purchasing software simply because competitors use it.
Frequently Asked Questions
What are the most important SaaS metrics for B2B companies?
The most important SaaS metrics usually include MRR, ARR, CAC, LTV, customer churn, customer retention, ARPA, and sales conversion rates. The right priorities depend on the company’s business model and growth objectives.
Which SaaS metrics tool is best for beginners?
Spreadsheets such as Google Sheets or Excel can be useful starting points for basic calculations. Google Analytics 4 and a suitable CRM can provide additional visibility into website performance and sales activity.
Are free SaaS metrics calculators useful?
Yes. Free SaaS metrics calculators can help businesses estimate recurring revenue, acquisition costs, lifetime value, churn, and retention. However, calculations are only as reliable as the data and assumptions used.
Do B2B SaaS companies need multiple analytics tools?
Not necessarily. A small business may operate effectively with a CRM, website analytics, and a spreadsheet. Additional tools become useful when reporting needs grow or when existing systems cannot provide the required insights.
How often should SaaS metrics be reviewed?
Many companies review operational indicators weekly and financial performance monthly. The ideal schedule depends on sales cycles, data availability, business size, and the speed at which management needs to make decisions.
What is the difference between SaaS analytics tools and SaaS metrics calculators?
SaaS analytics tools collect and analyze data, often providing automated dashboards and historical reporting. SaaS metrics calculators generally apply formulas to supplied inputs to estimate specific indicators. Both can be useful, but they serve different purposes.
Conclusion
Choosing the right SaaS metrics tools is an important step toward building a sustainable B2B software business. The most useful tools help companies understand recurring revenue, customer acquisition costs, lifetime value, churn, retention, website performance, and product engagement.
Platforms such as ChartMogul and Baremetrics can support subscription analytics, HubSpot can help connect sales and marketing activity, Google Analytics 4 can measure website performance, and Mixpanel or Amplitude can provide insights into product behavior. Power BI offers flexible business intelligence capabilities, while Excel and Google Sheets remain practical options for custom SaaS metrics calculations.
The best approach is to start with the business questions that matter most, select tools that provide reliable answers, and expand the technology stack as reporting needs evolve.
By combining accurate data, consistent metric definitions, and regular performance reviews, growing B2B companies can make more informed decisions, improve customer relationships, and build a stronger foundation for long-term SaaS growth.






Leave a Reply